

The 100 Million Barrel Blind Spot
Imagine if every person on the planet carried a 2-litre soda bottle filled with crude oil and poured it into the global machine every day just to keep civilisation functioning.


Early morning, and the servo forecourt has that familiar smell. Petrol and warm rubber, with a faint chemical sweetness that sits at the back of your throat.
You watch a tanker pull away, slow and careful, its tyres whispering over the concrete. You look back at your pump, at the hose reels, and the numbers clicking up. A small private ritual of modern life.
The tanker just dropped over 30,000 litres into the storage tanks beneath the concrete.
Now you do the impolite scaling. That one tanker is a rounding error in a system that refills itself every 24 hours.
The Hard Number
The most important fact about oil right now isn’t the price, or the politics, or even the climate argument. It’s the scale of the daily flow.
100 million barrels a day.
One standard barrel of crude oil is 42 US gallons, about 159 litres. A standard Toyota Camry has a fuel tank size of approximately 60 litres. Barrels are a unit that politely hides the physical reality.
If you want to feel the size of the global engine, try thinking of 15.9 billion litres, enough to fill 6,400 Olympic swimming pools of oil.
With a global population of roughly 8.2 billion, the average is about half a gallon of oil per person per day. That is not what you personally burn, but the system average, embedded in transport, supply chains, freight, industrial heat, and the services you touch without seeing.
This is not just a statistic. It is a relentless, high-pressure torrent that keeps every grocery shelf stocked, every pharmacy supplied, and every commute possible.
This is the throughput that defines our world.
Framing the hard number
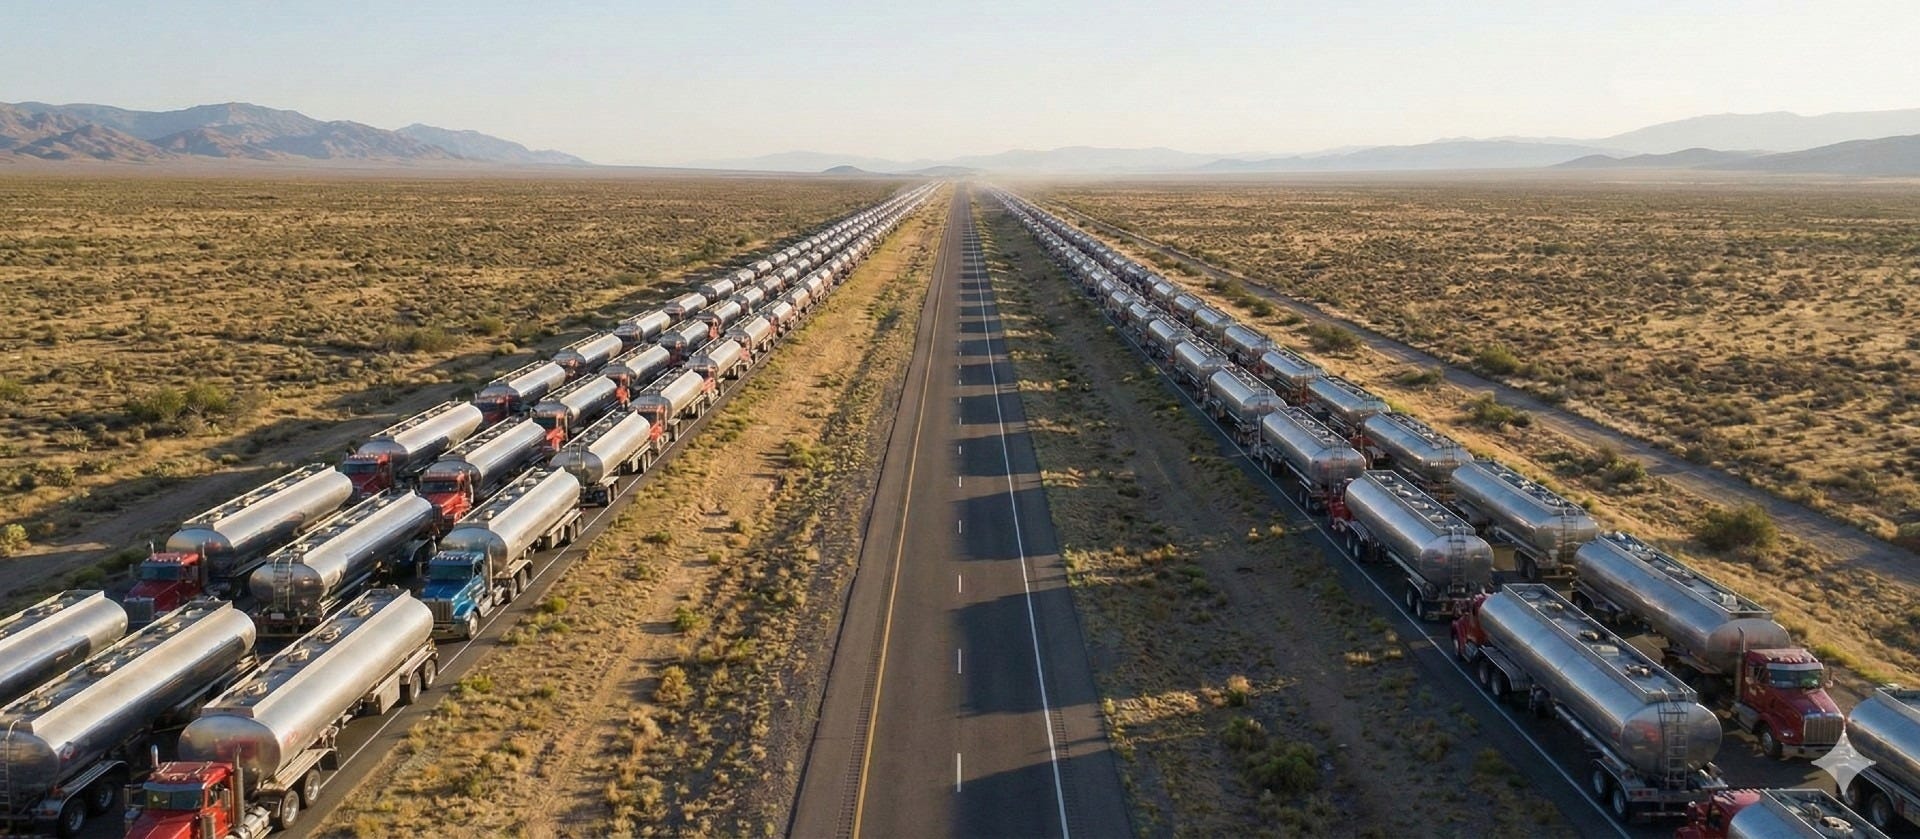
A large highway tanker truck typically carries about 38,000 litres (10,000 gallons), around 220 barrels.
You would need 420,000 such rigs to carry one day of global oil consumption.
Lined up bumper to bumper, at about 70 feet per rig, that queue stretches 8,960 km (5,568 miles).
Park them as two parallel lines, and you get a double column of tankers about 2,784 miles long, roughly the distance from Los Angeles to New York City, with some trucks left over in the telling.
To park 420,000 tanker trucks, tightly but with minimal manoeuvring aisles, the parking lot would cover 4,300 hectares (10,600 acres), around 43 km2 (16.5 square miles)
The weight of the oil alone would be about 14.7 million tons, roughly the tonnage of 140 Nimitz-class aircraft carriers.
This is the daily heartbeat. Every 24 hours, the lot empties and refills.
If you want to change the system, you are not swapping a product. You are substituting a daily planetary scale logistics event, plus the infrastructure that assumes it, plus the institutional promises built on top of it.

Behind the hard number
The popular story is tidy. EV uptake rises, renewables expand, efficiency improves, the curve bends, progress continues.
The system underneath is messier. Oil isn’t just in cars. It’s in how freight moves, how mining runs, how food is grown and delivered, how roads get maintained, how inventories are buffered, how spare parts show up, and how cities tolerate distance.
People mention new capacity as if it cleanly displaces old capacity one-for-one. In reality, new capacity often rides on top of a larger total energy demand, or displaces only at the margin, or displaces in one geography while demand rises in another.
Here is the undeniable global pattern…
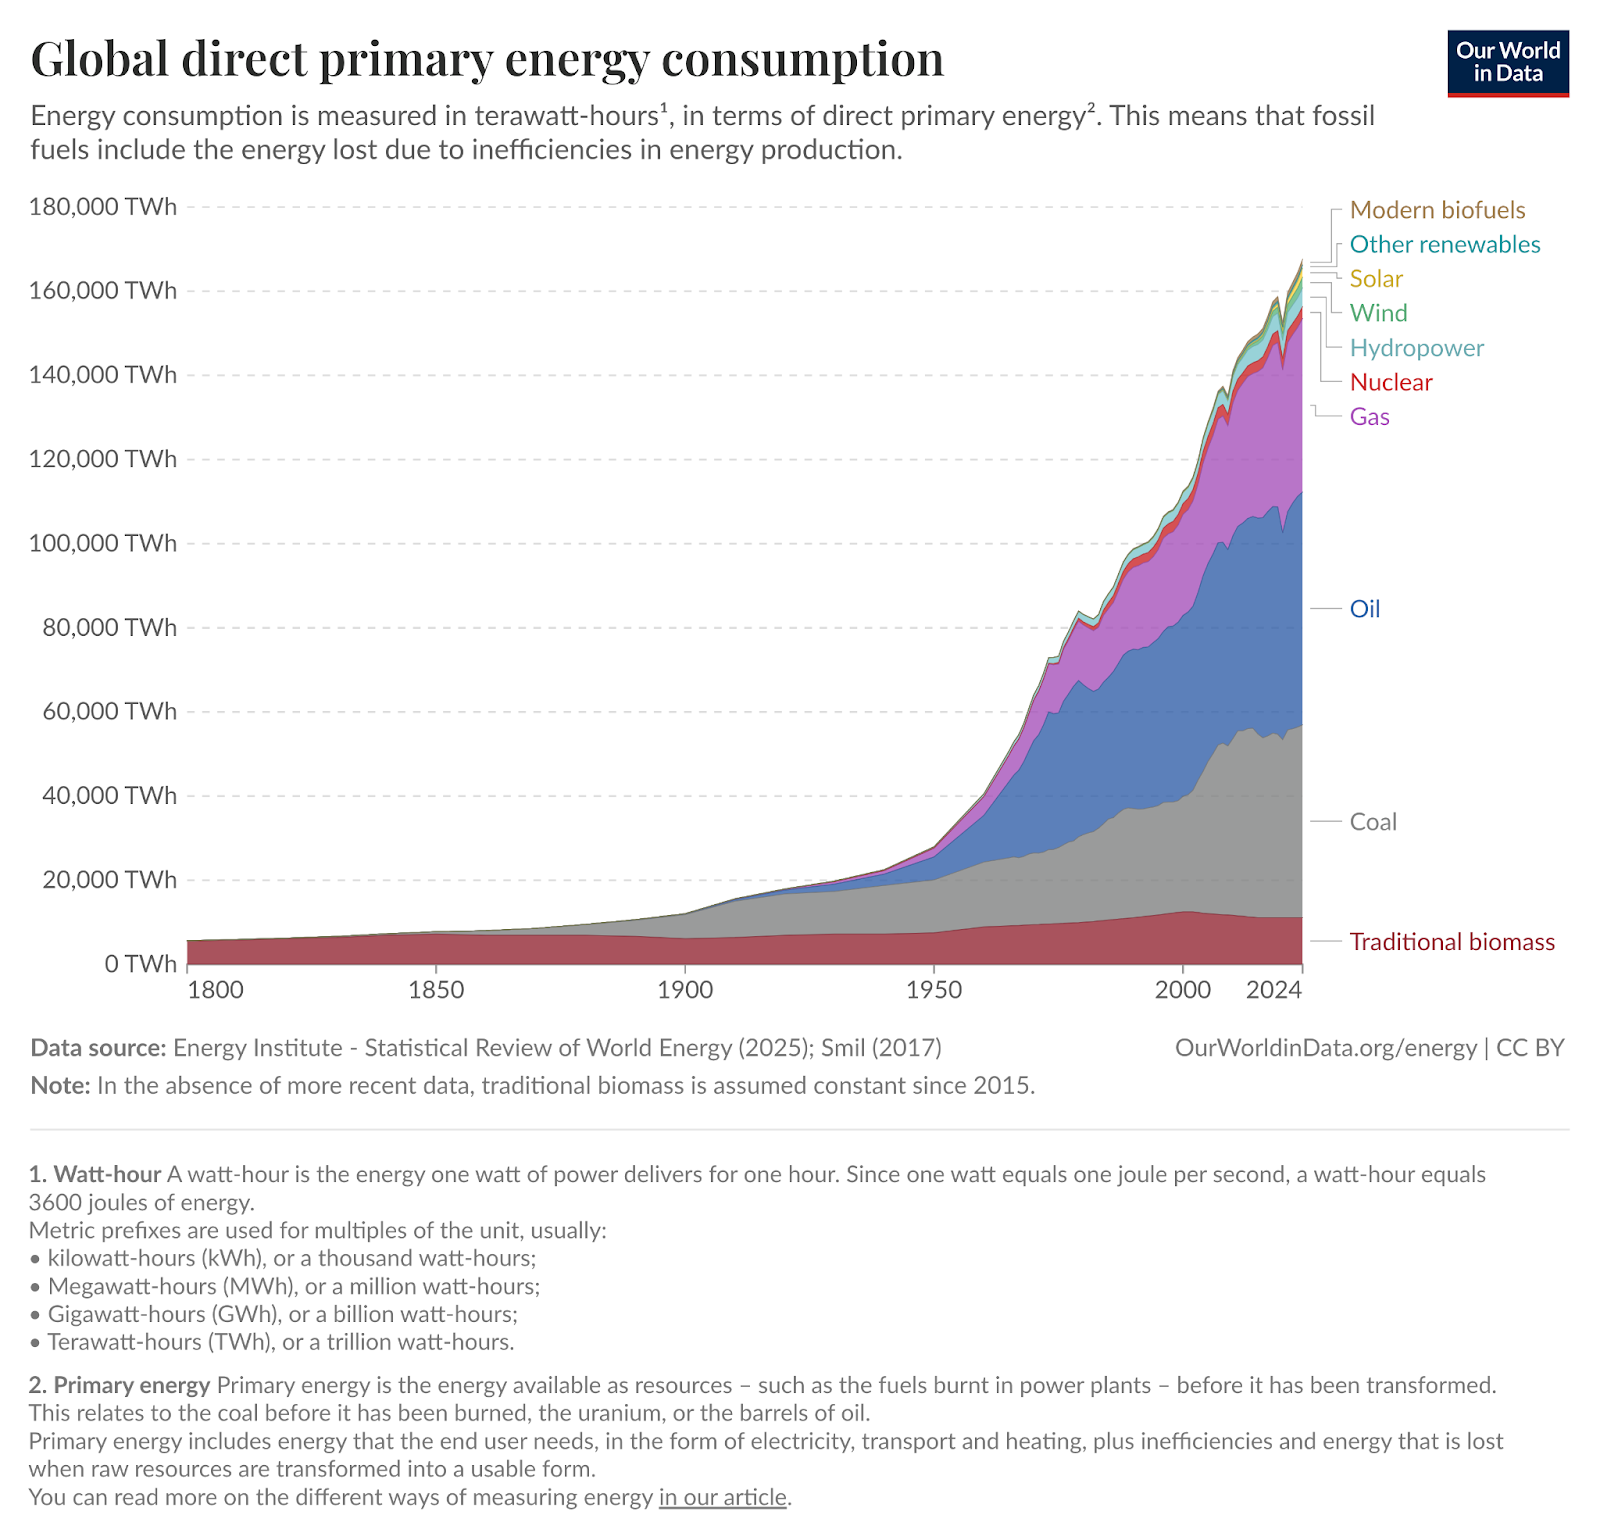
Even though the production of energy from alternative energy sources are more efficient than fossils, they are not really replacing them. They are just another option to meet the rising demand.
Transition likelihood
100 million barrels a day is the throughput; then there’s the stock.
Most of the world’s useful machines already exist. Cars, trucks, tractors, ships, furnaces, boilers, generators, and the industrial processes built to run on liquid fuels. Transition is partly a manufacturing project. It’s also a replacement project that can only go so fast.
And energy isn’t just consumed for fun. It’s consumed to deliver services people now treat as a default expectation for on-time freight, cheap flights, cold chains, 24-hour supply, and digitised everything. In theory, you can decarbonise by reducing service levels, but that is politically hard to say out loud.
A 100 million-barrel-a-day reality is very awkward on a scoreboard. It is too large to fit into a single victory lap. So it is often divided into less threatening pieces, replaced with trends, or discussed around future targets.
There is also a second-order effect that sits behind many efficiency wins. If you make energy services cheaper, you often increase total demand for them. Efficiency, such as when power comes directly from electricity, buys time. It does not guarantee lower total throughput.

So the trap is not that people are lying. It is that institutions are doing what institutions do. They translate uncomfortable constraints into stories we can be told.
Back to the front
Meanwhile, back at the servo, the tanker is already gone. Another will arrive. The forecourt will keep smelling the same.
The oil story still lives in the daily refill, but at least the servo now has a few fast charging stations.
If you want to know which one is steering, follow the trucks.
Being a Mindful Sceptic
A mindful sceptic uses curiosity and critical thinking to rigorously question ideas and demand evidence, while being aware of what matters, when it matters, and how to avoid the trap of cynicism.
So what do we do with the hard number of 100 barrels of oil a day?
Track the flow, not the virtue. Ask what the daily throughput is, and whether your preferred intervention actually moves the denominator.
Convert abstract units into physical logistics. Barrels to gallons. Gallons to trucks. Trucks to distance. It stops the brain from accepting a number without feeling its weight.
Watch for rebound. When a technology improves efficiency, ask where the savings go. Lower unit cost often expands use.
Interrogate the scoreboard. For any confident claim from ministers, tech bros or oil barons, write the ledger entry… value, unit, year, geography, boundary, denominator, source. If you can’t fill the fields, downgrade the claim.
Separate transition progress from transition sufficiency. EV growth can be real yet still insufficient relative to the daily baseline. Both can be true at once.
Mindful Momentum
Do a one-week Energy Ledger Audit.
Pick one claim you believe about the energy transition, from a report, a keynote, or your own industry deck.
Write it as a ledger entry that should include most of these elements:
Claim | Value | Unit | Year | Geography | Denominator | System Boundary | Source | Confidence | What would change my mind
If you cannot fill the denominator and the boundary, downgrade the claim and stop using it as a foundation for decisions. This is good evidence evaluation and measurement hygiene.
Key Points
The denominator is enormous. A barrel is 42 US gallons (~159 litres), so “100 million barrels a day” is ~4.2 billion gallons every 24 hours in 2026.
This is a logistics constraint, not a vibe problem. Convert the flow into trucks, and it lands as ~420,000 10,000-gallon rigs per day—about 5,568 miles of queue.
Progress can be real and still not be sufficient. Incentives favour clean narratives and headline metrics, while the denominator stays huge; efficiency can rebound into more use. A mindful sceptic asks for the denominator, the boundary, and the replacement tempo before buying the story.